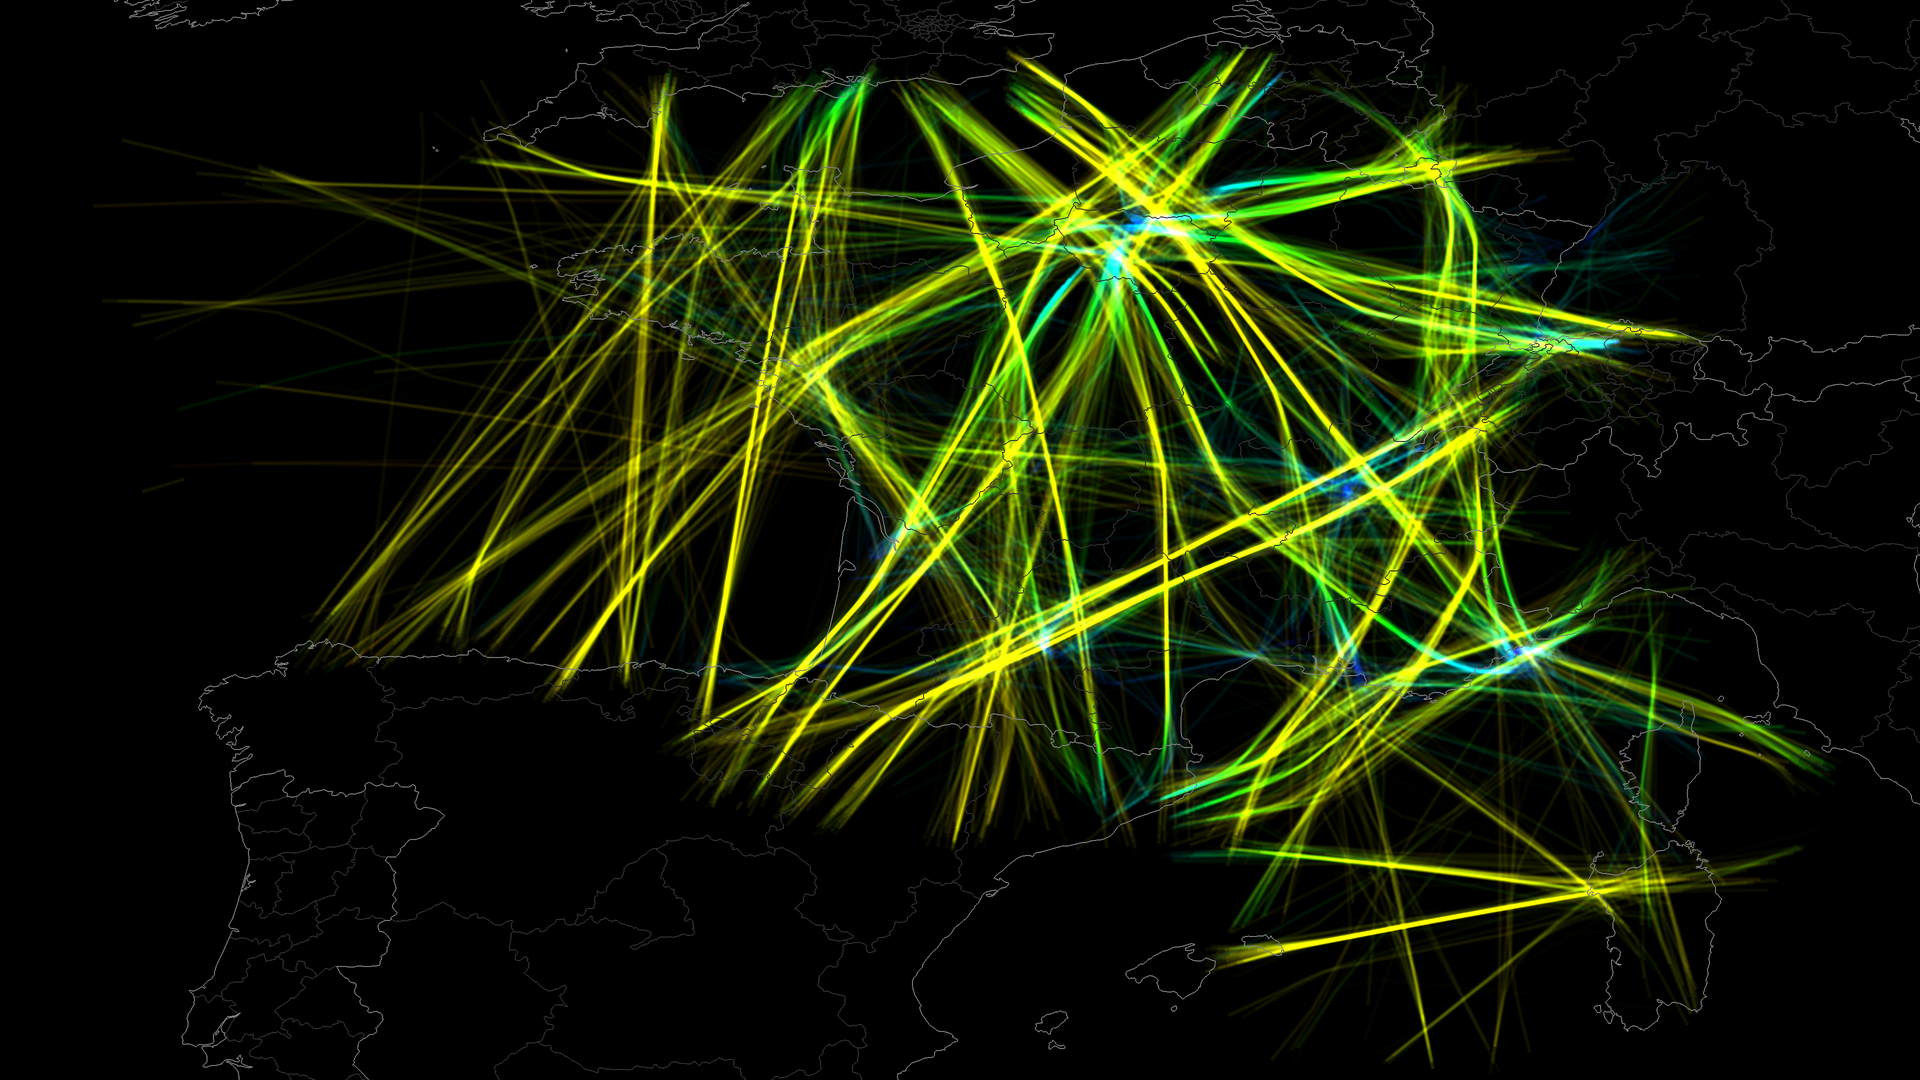
Very nice Tim - I love the way you smear out the data.
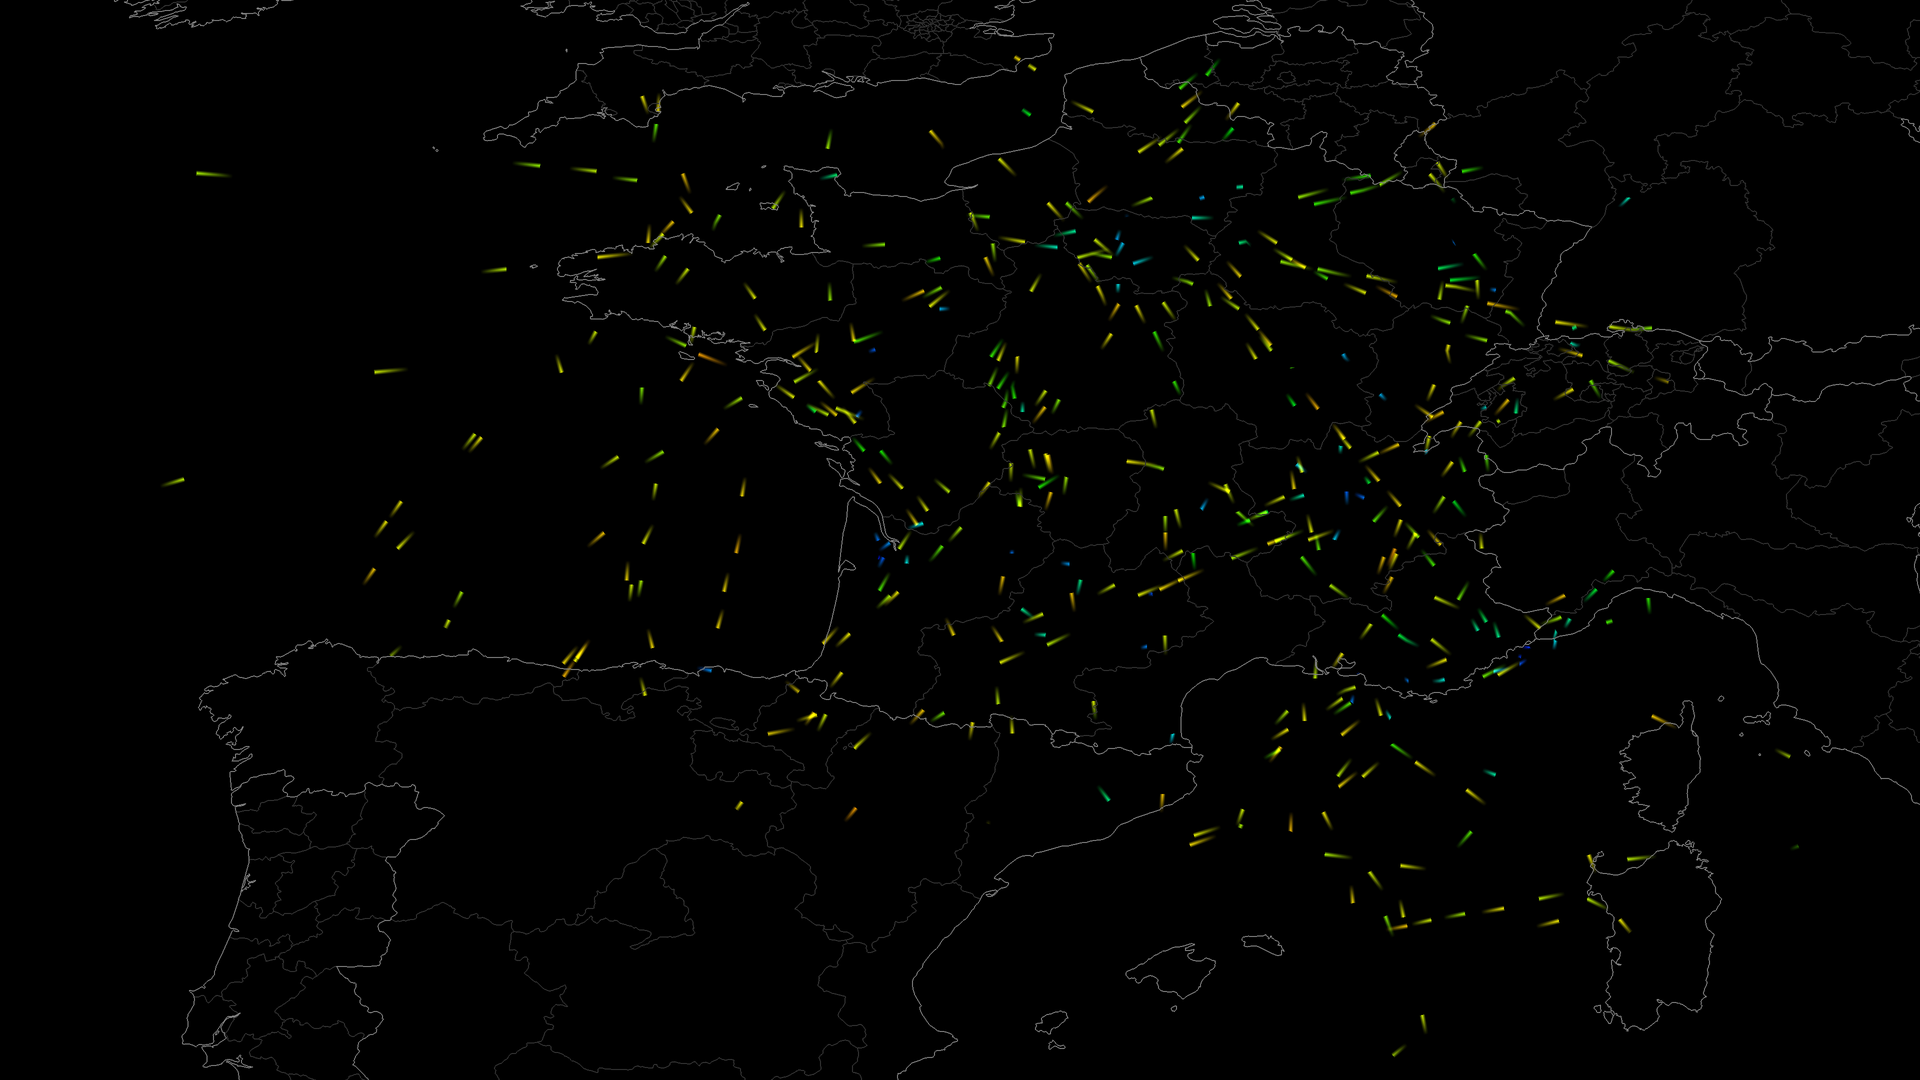
I found plotting the data over Europe and the US to be a difficult visualization problem - there is just so much data in a small space. Perhaps changing the size of each point depending on your distance would work?
I found plotting the data over Europe and the US to be a difficult visualization problem - there is just so much data in a small space. Perhaps changing the size of each point depending on your distance would work?