Hacker News new | ask | show | jobs
by timmipetit 4133 days ago
Yeah, especially Europe is really hard. We haven't found a solution yet for visualizing detailed information above very dense and scarce areas at the same time. Showing the data above a single country in Europe works a lot better (for example: http://www.cs.rug.nl/svcg/uploads/SoftVis/trails_length_1.pn... and http://www.cs.rug.nl/svcg/uploads/SoftVis/trails_length_4.pn... ). We use an option to reduce the point size based on the zoom-level.

If someone is interested, here are 2 more videos of our visualization

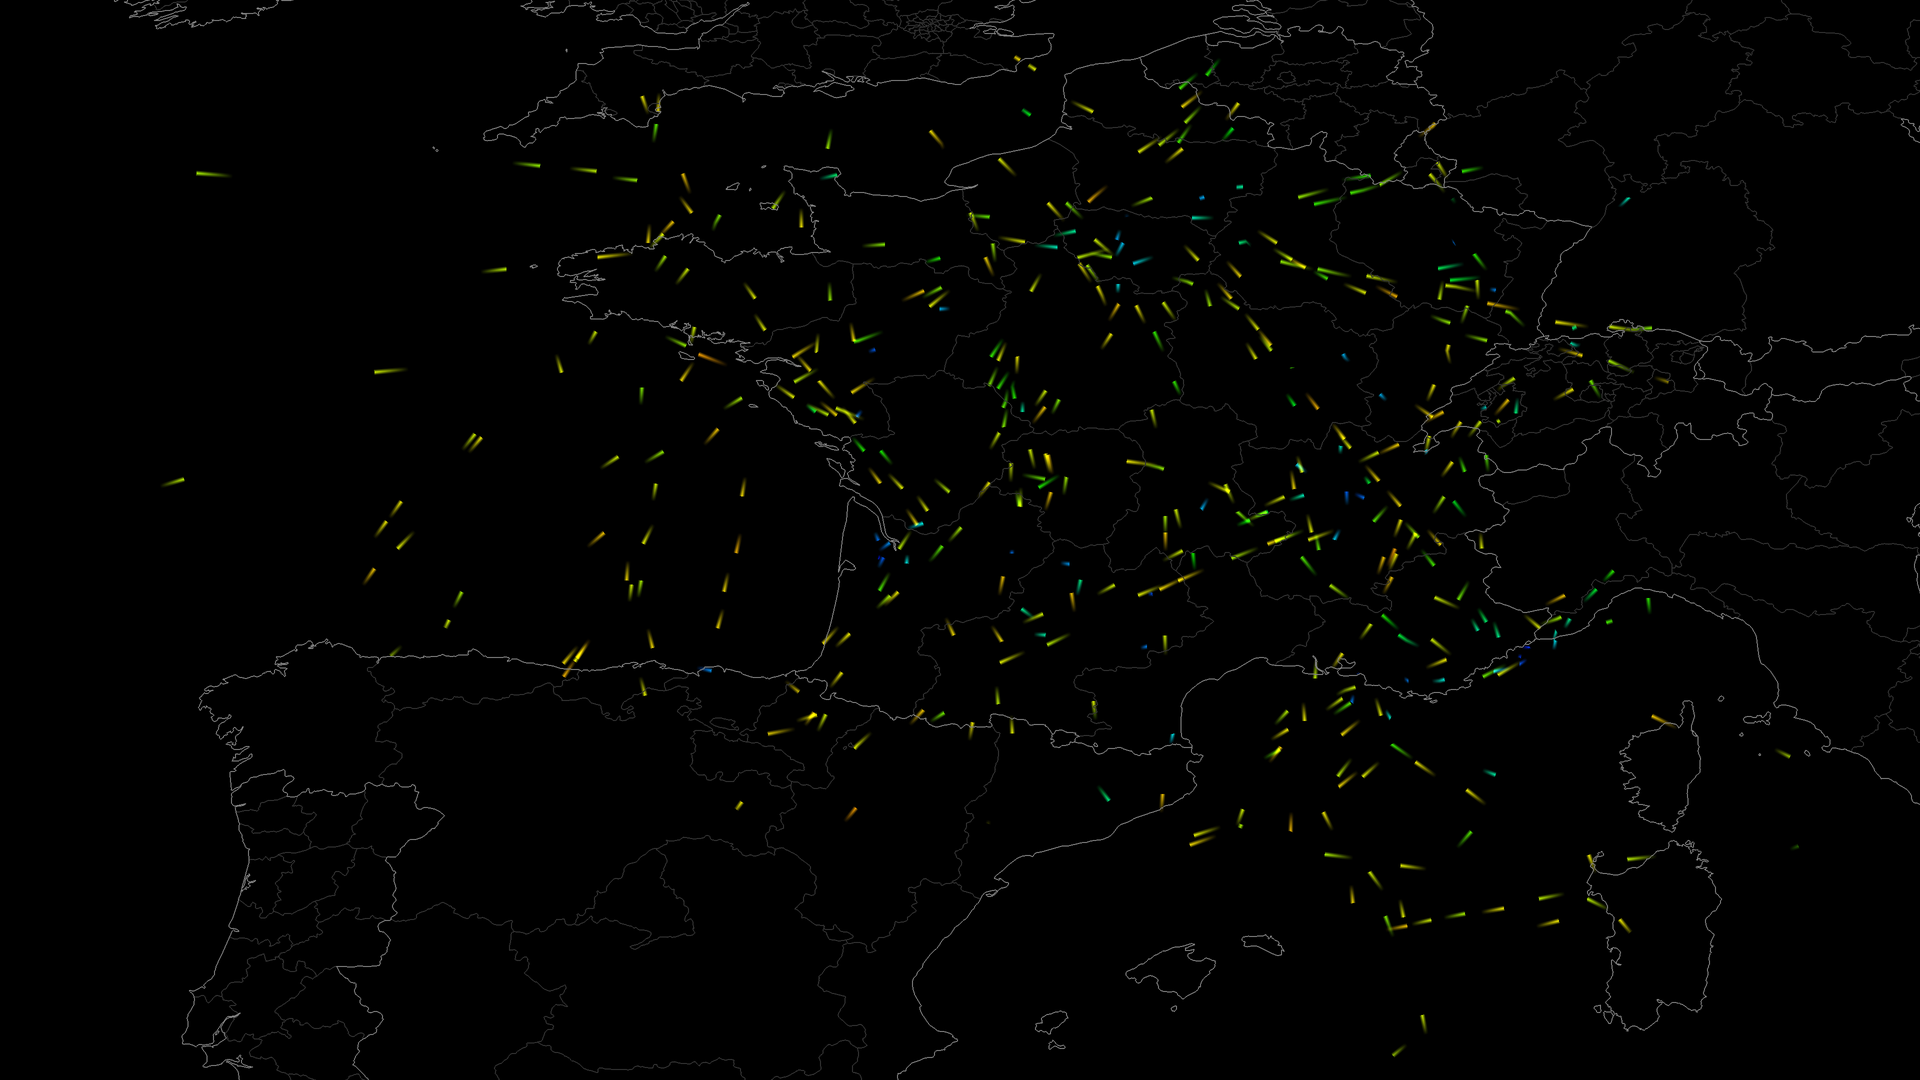
* https://www.youtube.com/watch?v=GYfBvQGKE9Y (short pulse-trails with background context, colored by altitude, above France)

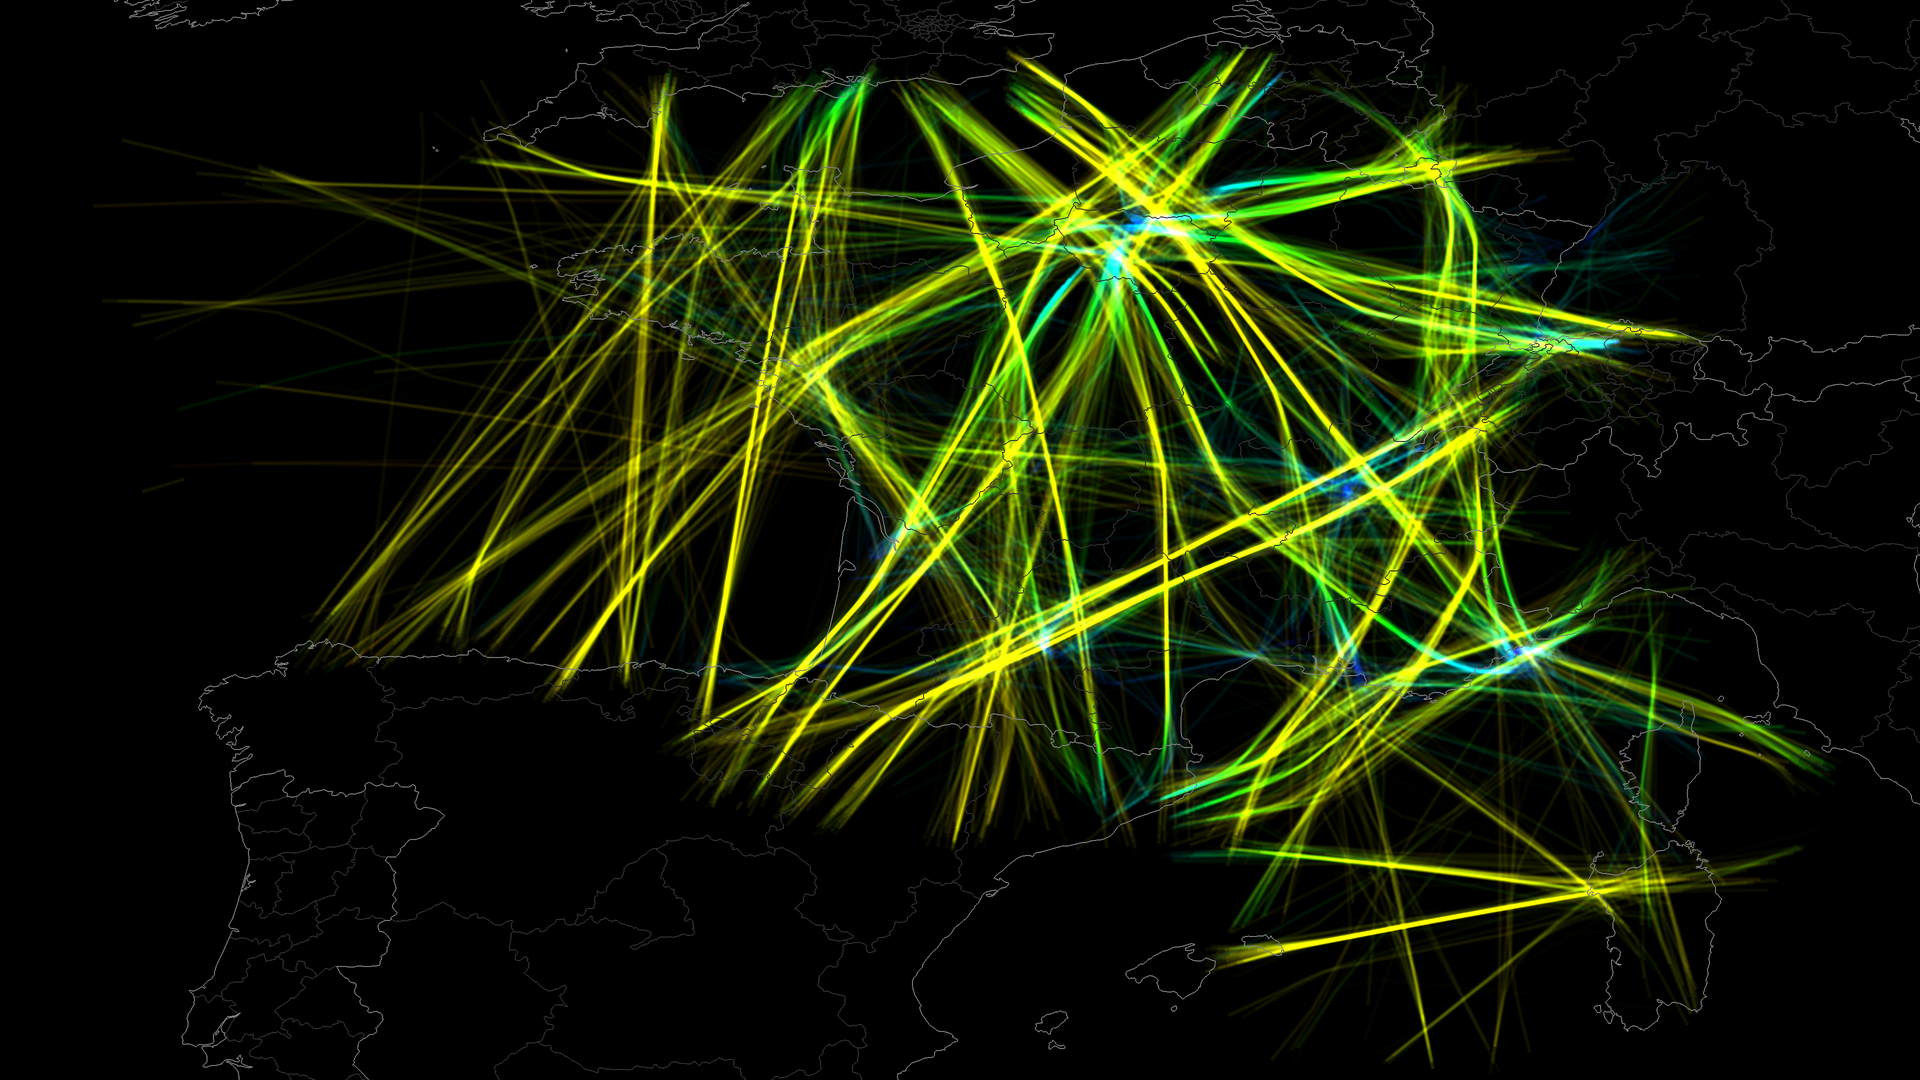
* https://www.youtube.com/watch?v=0oqxIhO69tU (medium pulse-trails, no background trails, colored by direction).

For more information and pictures: http://www.cs.rug.nl/~alext/PAPERS/MSc/klein14.pdf