Hacker News new | ask | show | jobs
by _zbap 4012 days ago
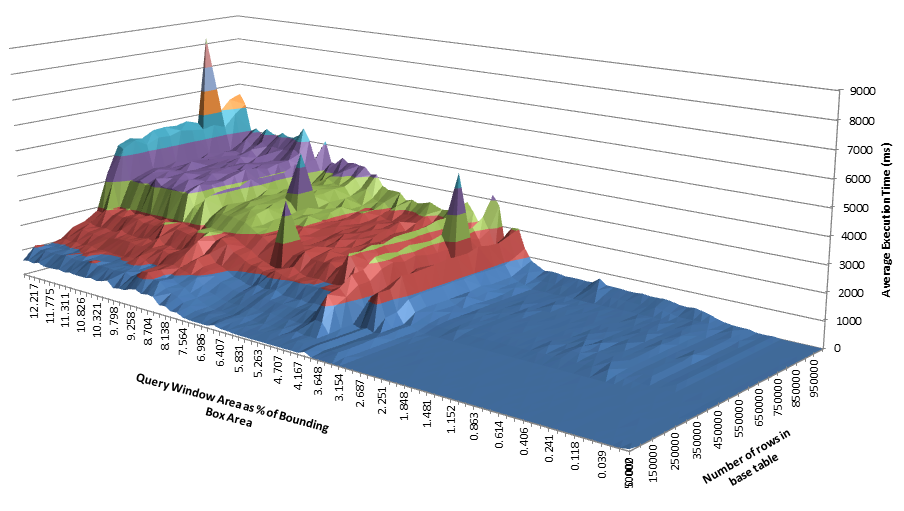
So here's what medical fraud looks like: http://i.imgur.com/jMvUqqK.jpg

Sorry, crappy excel graph, but, it was meant to be a quick and dirty look at 12 GB of prescription data that got analyzed by a few programs I wrote back in 2009, give or take a year. Took days to crunch numbers after it was written. Anyhow, looks like an imaginary city skyline, right?

Going from left to right, lets call it the X axis, are various diagnostic codes used to prescribe medication. So on the left side it's like code 400, on the right side 500. In between is 401.3, and so on. Been awhile, so can't remember the exact numbers but bear with me. The drugs range from opiates to diflucan for yeast infections, to whatever else. So you kind of see a distribution range that's normal.

On the Y-axis, are years. Here's the slightly confusing part of the graph: I striped 4-5 clinics worth of data on that axis. So on that axis, only 6 years of data are shown per clinic. What shows up after the first 6 long rows is a different clinic, and so on.

The Z-axis is a frequency of prescriptions. Like, how tall a tower is means how many prescriptions were written for a particular medication, by a particular clinic, on a particular year.

If you look at the nearest 6 long rows, that's 1 clinic, 6 years of operation and you see nothing but flat lines. No yeast infections, no eye drops, no steroids. Just some really insanely tall towers. One of the towers gets clipped from the graph because it's that insanely taller.

The tallest towers were the most expensive drugs and treatments that the government reimbursed the clinic for, so they took a shortcut and just went for those. The kicker is that they only got caught when we started investigating. There was a tip. Someone reported something weird about the clinic. So, we went up to the state and asked for an anonymized data dump of the clinic in question, and then absolutely nothing happened. The state stalled for 6 months before finally giving the data up. Turns out, they were only alerted to the fraud after we asked questions about the clinic, and they wanted to take corrective actions before disclosing anything to us so that it didn't seem like they were sleeping on the job.

I don't know what to say. I get it, this stuff is complicated, the data sets are huge, and there are more blindspots than you'd think. Lack of oversight is too strong of an accusation for me to wield, but there was definitely a fear of criticism. What I'm trying to say here is that computational detection is only a small fraction of the real issue. The bigger issue is the guarded cultural environment in which all these agencies exist, and without intimate knowledge of how they work and what is possible, there's no silver bullet.

2 comments

So it looks like you've got data for four clinics in there. Of the three non-fraudulent clinics, two show pretty elevated levels of that particularly lucrative code, the one that clips the ceiling for the fraudulent clinic. How much of that is fraud?

The fraudulent clinic has something really bizarre going on, too. In the first year (years being in order lavender, red, yellow, green, black, and peach), they've got a big spike at the ultra-lucrative code and some other big spikes at other codes. In year 2 (red), they've got just the one spike, a smaller version of their second-biggest spike from year 1. In year 3 (yellow), they've got one "spike", but it's tiny. In years 4 and 5 they've got practically nothing at all. What were they doing then? Didn't they want any money at some point in that three-year period?

Sorry, user logicallee explained this better than I did. You're looking at 4-5 graphs put next to each other for comparison. The nearest flatland with the huge towers is the one troubled clinic.

Here's an annotated version of that, drawn by a child apparently: http://i.imgur.com/1dcuuXI.png

As you can see, data of the clinic we were investigating is the first 6 long rows, and ones behind it are clinics we were not investigating. We asked to compare a number of clinics so not to tip our hand, and the administration took half a year of paranoid data checking before giving it to us.

I know, not the most intuitive graph, but the graph was meant to be a diagnostic for only me, the person who composed the data. As you can see, a single glance at the graph revealed the problem, without involving any numerical analysis.

thanks, though seemed to me thaumasiotes who I replied understood perfectly! In particular he is correct that "Of the three non-fraudulent clinics, two show pretty elevated levels of that particularly lucrative code, the one that clips the ceiling for the fraudulent clinic. How much of that is fraud?" which he only could tell by correctly interpreting the graph (reading across that drug's column) - and it's a good question.

His second paragraph was only about the one clinic in question, he ignored the other 3 in his second paragraph, though he wasn't explicit about this, and asked a year-over-year question about the drug, concerning clinic A only.

My point was kind of tangential, that, INCIDENTALLY if the colors matched up in the rows (were repeated in the same order 4 times) you could look at it another way visually that you can't right now without counting by hand. Specifically, you could look at the aggregate trend for all four clinics year-over-year for the drug in question (the one with the spike) by seeing with your eye how the six colors move as you move your eye from Stripe A, to Stripe B, to Stripe C, to Stripe D. Right now, with your eye you can only tell or ask about year-over-year changes for a specific drug for clinic A, not for the other ones. If all four 2009's were peach, you could easily tell if there were 4 spikes in that year or just one. In fact in 2009 all four do seem to spike somewhat. Not being able to visually see aggregate year-over-year comparisons is probably the downside to the current presentation.

Ah, I see, and take your point. I should have worked on a more reader-friendly version of this graph so I just assume people don't understand its bizarre nature. But, my work had been done many years ago with the investigation.

Here's the part that stood way out even with that unsophisticated graph: the flat land between various prescription codes. It's just there. It draws the eye and makes you ask questions, which is what we did. Another dimension not pictured there is distribution of doctors vs prescriptions. Theirs stood out on that too.

Even in their busiest years, they didn't treat any common ailments with any degree of distributed variety. By contrast, rest of the clinics did business as usual: whoever walked through their door got treated for whatever random thing they had.

Just based on eyeballing the graph, I'd say there's a cultural element to what codes get used, because individual clinics often show more or less activity at a particular code for all six years. Choosing a code is something of a gray area, so that's not necessarily malicious, but I think "whoever walked through their door got treated for whatever random thing they had" is slightly oversimplified -- the patients will have been treated appropriately, but local culture will have pulled them into being coded in certain ways over other, arguably equally-applicable ways.

(Clinics having their own "personality" in coding could also be explained by the clinics having locally well-recognized specialties. That's hard to evaluate without knowing which codes are which.)

Just a note on the data presentation :)

Your analysis shows why it's kind of a shame GP had to 'stripe' the years rather than having another dimension (i.e. the striping is such that long-row closest to us to long-row farthest from us goes clinic1-yr1, clinic1-yr2, clinic1-yr3, clinic1-yr4, clinic1-yr5, clinic1-yr6, clinic2-yr1, clinic2-yr2, etc: i.e. 1,2,3,5,6,1,2,3,4,5,6,1,2,3,4,5,6) That means that rows don't actually form a data dimension: rather, we are looking at four independent graphs that are put one after the other without spaces. (The first graph is rows 1-6 with the row dimension being the year, the second graph is rows 7-13 with the year reset, etc.) See note for another way to see this.

It might be visually possible to see what happened at other clinics in yr1, yr2, yr3, yr4, yr5, and yr6, but at the moment the only way to do this is to read long-rows 1, 7, 13, 19, and 24 which is not obvious, you have to count to know what is what.

It would help if the colors corresponded (row 1 and row 7 had the same colors, so that color forms the year dimension), then you could look at the image from the perspective of different colors and see if anything sticks out. For example, if you wanted to see what happened in year 4 or 5 (as you mention), then you could look at all of the greens and blacks. (This means to identify a specific clinic-year you have to go by row number rather than color, but that seems OK to me - nobody is going to consult the legend consisting of 24 colors anyway.)

As it happens, it's a chore to count out what is year 4 and 5 for the other clinics and we lose this very important dimension visually. (Quick: tell me the tendency among all clinics as you move from year lavender, to red, to yellow, to green, to black, to peach in clinic 1).

However, I don't think that excel would have let you define colors in a custom way like this.

--

NOTE: You can tell that the rows don't form a data dimension, because it would be a mistake to connect all the points, like a topographic map -- like this: https://alastaira.files.wordpress.com/2011/04/image31.png -- . If you did that you should have a break between rows 6 and 7, between 12 and 13; and between 18 and 19 ---- because the slope between these specific rows is meaningless. On the other hand, if you DID have four such broken graphs next to each other, and within each graph they followed (repeated) the same color order, it would be easier to compare years. To further identify the color dimension the colors could move more predictably along the color scale (e.g. roygbi - red, orange, yellow, green, blue, indigo...)

> Quick: tell me the tendency among all clinics as you move from year lavender, to red, to yellow, to green, to black, to peach in clinic 1

The other clinics show reasonable self-similarity in years 3, 4, and 5. But the fraudulent clinic is reporting almost nothing at all. Not whatever codes it reported in the past, not whatever codes are worth the most money, not even randomly selected codes -- nothing. It's true that that might not be interesting if the other clinics showed similar behavior, but they don't. (And actually, I think "no medical demand for a three-year period" would be pretty interesting too.)

yes, it's unusual. I'd also like to be able to interpret that group of skyscrapers toward the right of the chart, for the third clinic. It's far more than what any other clinics prescribe (including the fraudulent clinic, which doesn't prescribe that drug) and also it is far more than anything else that that clinic prescribes. It is also fairly static year over year within that clinic. So what gives?
Thanks for interpreting that while I slept. Excel's 3D graph feature was just the quickest way to render this, since I was already tired of waiting for data to get reformatted.

Believe the original data was just a set of forms, each printed page stating prescriptions for a patient session. Basically nothing you could perform frequency counts without recomposing into a database, and that took days.

Mind linking where you got the data?
Sorry, this wasn't publicly available for download. After arm-wrestling the senior administrators for months and months, a reporter and I literally drove to pick it up and were given a set of DVDs by the State of Maryland health department, Mental Hygiene Administration, and a ton of other acronyms these people fall under.
Probably not the same source, but some interesting data available here - https://data.cms.gov/utilization-and-payment-explorer