|
|
|
|
|
|
by scaramanga
4342 days ago
|
|
|
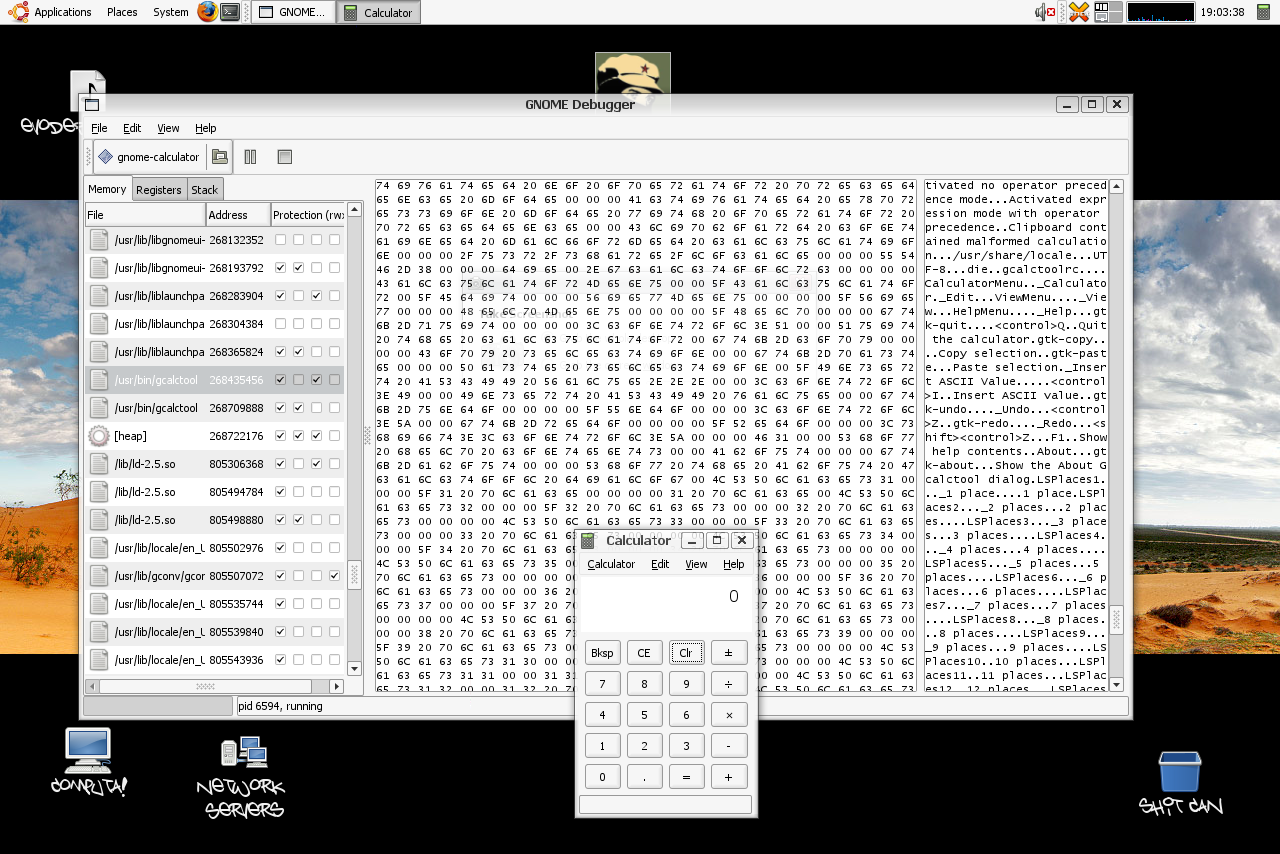
There's generally very little call for binary-level debuggers in linux. So everything is oriented towards source-level debuggng. Which makes sense since normally source code is available. IMO gdb isn't very good for binary-level debugging, which is pretty much a euphemism for reverse-engineering anyway. It'd be nice to have something like that. I tinkered around with building such a thing years ago[0] but I wanted it to be cross-platform (I was using PPC at the time). But found libdisasm to be a bit limited as a disassembler suitable for such a thing. [0]. http://www.scaramanga.co.uk/stuff/debugger/l33t-debugger.png |
|
|
Maybe it's just the way I use debuggers, but I don't find this to be a particularly compelling reason; I use instruction-level debugging quite often even when I have the source (debugging a program I wrote, when simpler methods fail), to [1] verify that the high-level language statements are doing the expected, [2] ensure that the compiler is generating the expected instructions, and [3] to observe where exactly the bug is.
> IMO gdb isn't very good for binary-level debugging
Having come from a Windows background, I'd say using gdb for that is an absolute nightmare - it appears to almost be designed to actively make it harder to do instruction-level debugging, despite the fact that the implementation of a debugger for source code is far more complex than one that doesn't. E.g. the "disassemble" command absolutely requires a symbol table, and will still complain if there's no "function" at some address, when all it really needs to do is start reading the bytes at the address it's given as a parameter - which could be the name of a symbol - and interpret them as instructions. Instead the somewhat unintuitive "workaround" is to use "x/i".