|
|
|
|
|
|
by chrismorgan
495 days ago
|
|
|
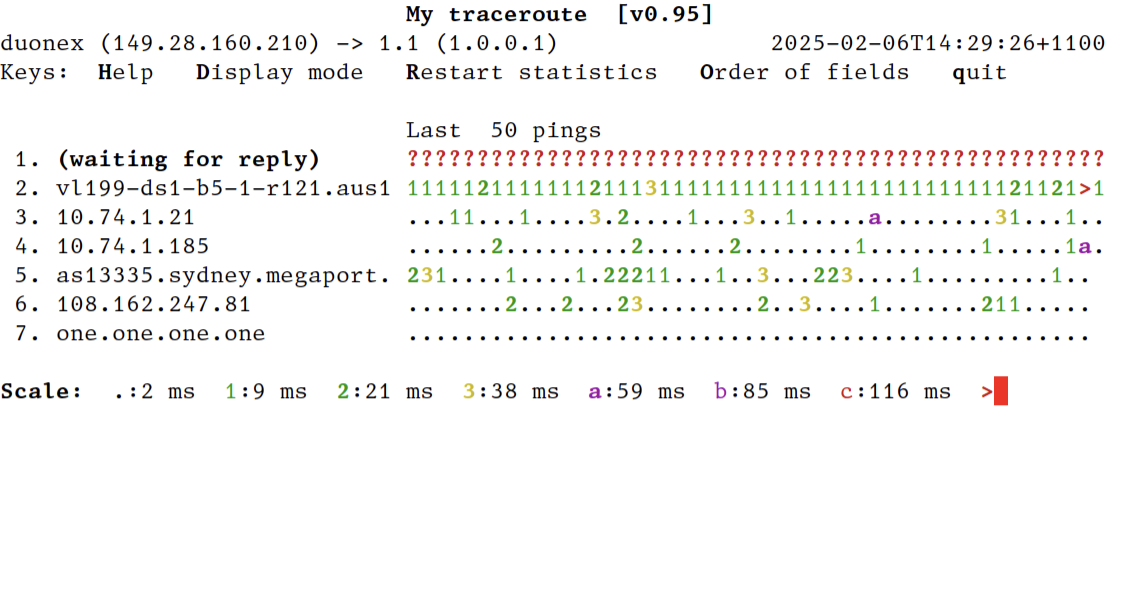
I normally have `mtr 1.1`¹ running in the background, in the third display mode, which is a 2D histogram—time in the x axis, hops in the y axis, and ASCII character/colour for ping time. When problems occur, this tends to let you easily see the nature of the problem—total loss, elevated packet loss, elevated response times; and to see the location of the problem—local network, local ISP, public internet. There are definitely occasions for loss%, sent, last/average/best/worst/stddev ping and such things as are found in the first display mode, but most of the time I find the histogram view most useful as the starting point. You can make mtr start in this view with --displaymode=2 (direct command line arguments, `mtr --displaymode=2 …`; or shell alias, `alias mtr="mtr --displaymode=2"`; or set environment variable MTR_OPTIONS=--displaymode=2). Screenshot of this mode: https://temp.chrismorgan.info/2025-02-06-hn-42924182-mtr-dis... —⁂— ¹ 1.1 = 1.0.0.1 = Cloudflare public DNS, a convenient nearby public internet endpoint. |
|
|