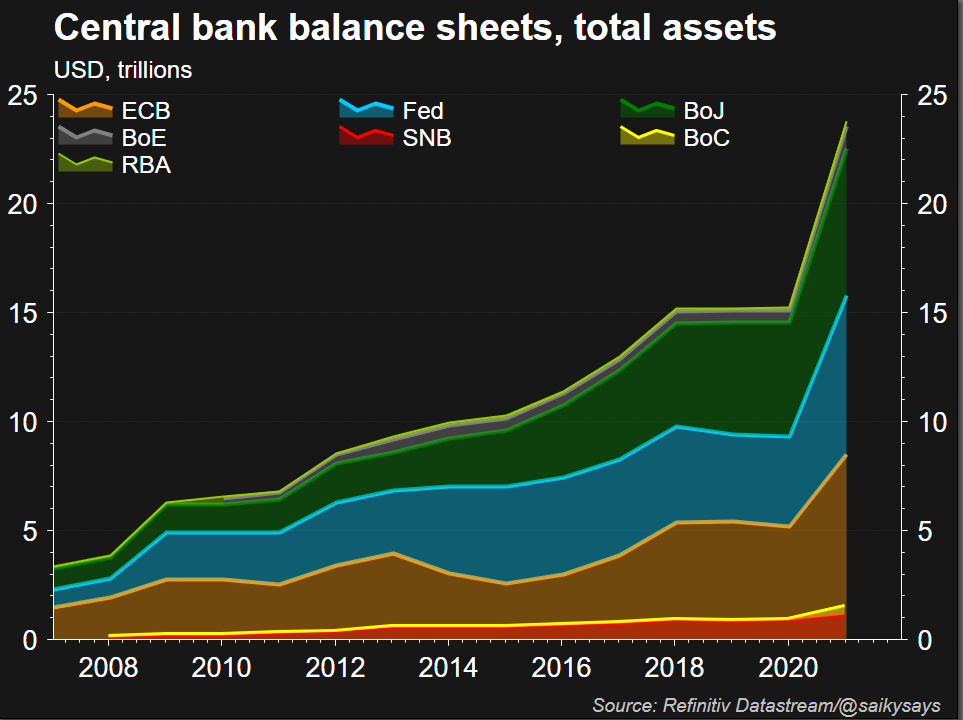
Help me understand: is this a stacked chart? Why does a chart that ends in 2021 show inflation in 2022 and 2023?
> This inflation is due to insiders (central bankers) printing money.
If this is about the money supply, why is food more affected than other products? IMO everything is a factor, and there is no one culprit, and therefore no one easy fix.
Imagine being a rational human looking at g7 central banks adding 40% to the money supply in <2 years, and your focus is "everything is a factor, there no one culprit" for price inflation.
I look forward to open source ai economic simulation tools - when you change variables like m2, you'll see what happens to inflation - and there'll be no more ambiguity
> Imagine being a rational human looking at g7 central banks adding 40% to the money supply in <2 years, and your focus is "everything is a factor, there no one culprit" for price inflation.
Imagine being a rational human and deciding that a war involving two of the biggest agricultural exporters in Europe, one of whom is also one of the main exporters of oil and gas, as well as a ton of different important materials (nickel, steel, fertilizers, etc.), after 2 years of pandemic that crippled global supply lines and resulted in explosion of prices in many raw materials, have combined absolutely no impact on prices anywhere.
just sayin': why did inflation appear when it did? why not sooner? why not later? Why is the impact of inflation non-uniform?
We know the model pretty well: "money printer goes brrr" leads to higher prices for good and services. But the data lately doesn't make a great supporting case.
> I look forward to open source ai economic simulation tools - when you change variables like m2, you'll see what happens to inflation - and there'll be no more ambiguity
Economists have been leading the way in multifactor causal inference, but GPT in particular is not well suited to it. And macroeconomics in particular is hard to measure via natural experiment, so you're left trying to estimate counterfactuals based on a paucity of data
but look, my day job is people coming to me with timeseries data showing an engineering fuckup and debating about what caused it (usually ops vs prod). if theres a nuanced take, im all ears, but so far your fire has brought more heat than light.
Unless people who can afford it are hoarding groceries an increasing monetary base shouldn't be affecting grocery prices. Only a decrease in supply versus demand, or increase costs of production, should be increasing grocery prices, if market manipulations aren't happening.
I actually do get it. An excess of money doesn't automatically make things cost more. An excess of demand with (more purchases), or for (higher prices), that money does. The demand excess has to start somewhere.
What do you think putting more money into circulation does to demand & nominal purchasing power?
An excess of money causes increased demand per unit dollar and subsequently, higher prices and inflation, through mechanisms including the Cantillon effect, changes in monetary velocity etc.
If i deposit more $ in your bank account, what happens to your nominal demand?
If it was as simple as you say, why didn't we see double-digit inflation in 2021 and 2022 when the money in questions was actually being handed out? There are multiple factors at play here with "money machine goes brrr" being only one of the causes of inflation.
> What do you think putting more money into circulation does to demand & nominal purchasing power?
Ideally people would save for a rainy day. But people don't, and can't, always do this. Because for some this is the rainy day.
Non-ideally I would assume that most demand increases would go for non-groceries, and non-commodities in general, such as housing and travel, though I would expect some increase in durable goods commodity prices as people replace older goods with newer. Yet here we have grocery price increases. Are salaries in the grocery production chain going up 18%? Warehouse costs? I doubt it. The price increases are mainly coming from elsewhere, not from money printing.
It doesn't have to be groceries that they're buying. Factories in China producing non-essential consumer goods run off the same natural gas supplies that could otherwise be used to make fertiliser. Jets taking tourists on vacations run on basically the same fuel that could go into farmers' tractors or lorries transporting food to stores. More money allowing people to make more non-essential purchases impacts food supply if the global economy and global fossil fuel supply don't have the capacity to produce that stuff, and it turns out they didn't.
Sure. But there's a more immediate impact to fossil fuel supplies in the UK than an increase in demand. An increase in demand from an increased money supply is likely a contributing factor, but not the sole cause that elevenoh4 says it is. Has fossil fuel demand even fully bounced back to what it was in 2019?
Help me understand: is this a stacked chart? Why does a chart that ends in 2021 show inflation in 2022 and 2023?
> This inflation is due to insiders (central bankers) printing money.
If this is about the money supply, why is food more affected than other products? IMO everything is a factor, and there is no one culprit, and therefore no one easy fix.