|
|
|
|
|
|
by speakspokespok
1474 days ago
|
|
|
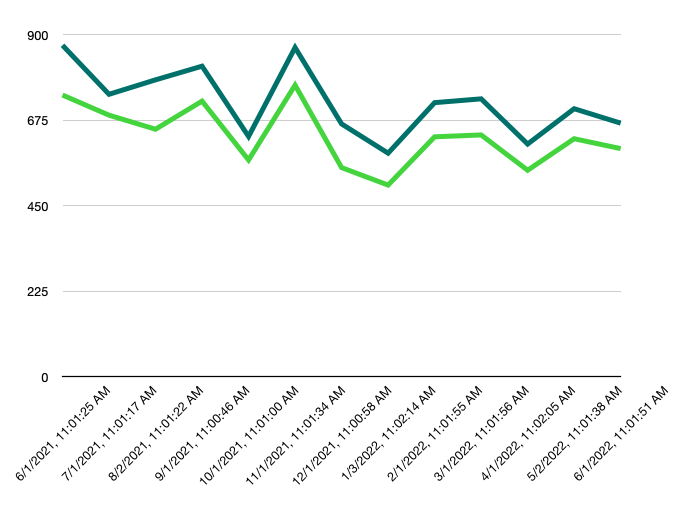
Your blog post starts by discussing posts being down this month (June 2022) but the graph provided starts in 2011. For the sake of the discussion, a second graph that starts June 2021 to current, and in monthly increments would be more enlightening. Because ultimately I think that's what we all want to know. In your copious free time would you mind adding that? Thank you for writing this. |
|
|