I’m kinda surprised by these numbers. My impression of the us is that many immigrants will be unskilled and have low incomes, but that their children will be much better off in comparison. So a few reasons these numbers could be this way:
1. My intuition is wrong
2. There are lots of people in low income groups where there is little i regeneration along mobility for structural reasons, or maybe immigrants children who often see the biggest improvements are excluded for some reason.
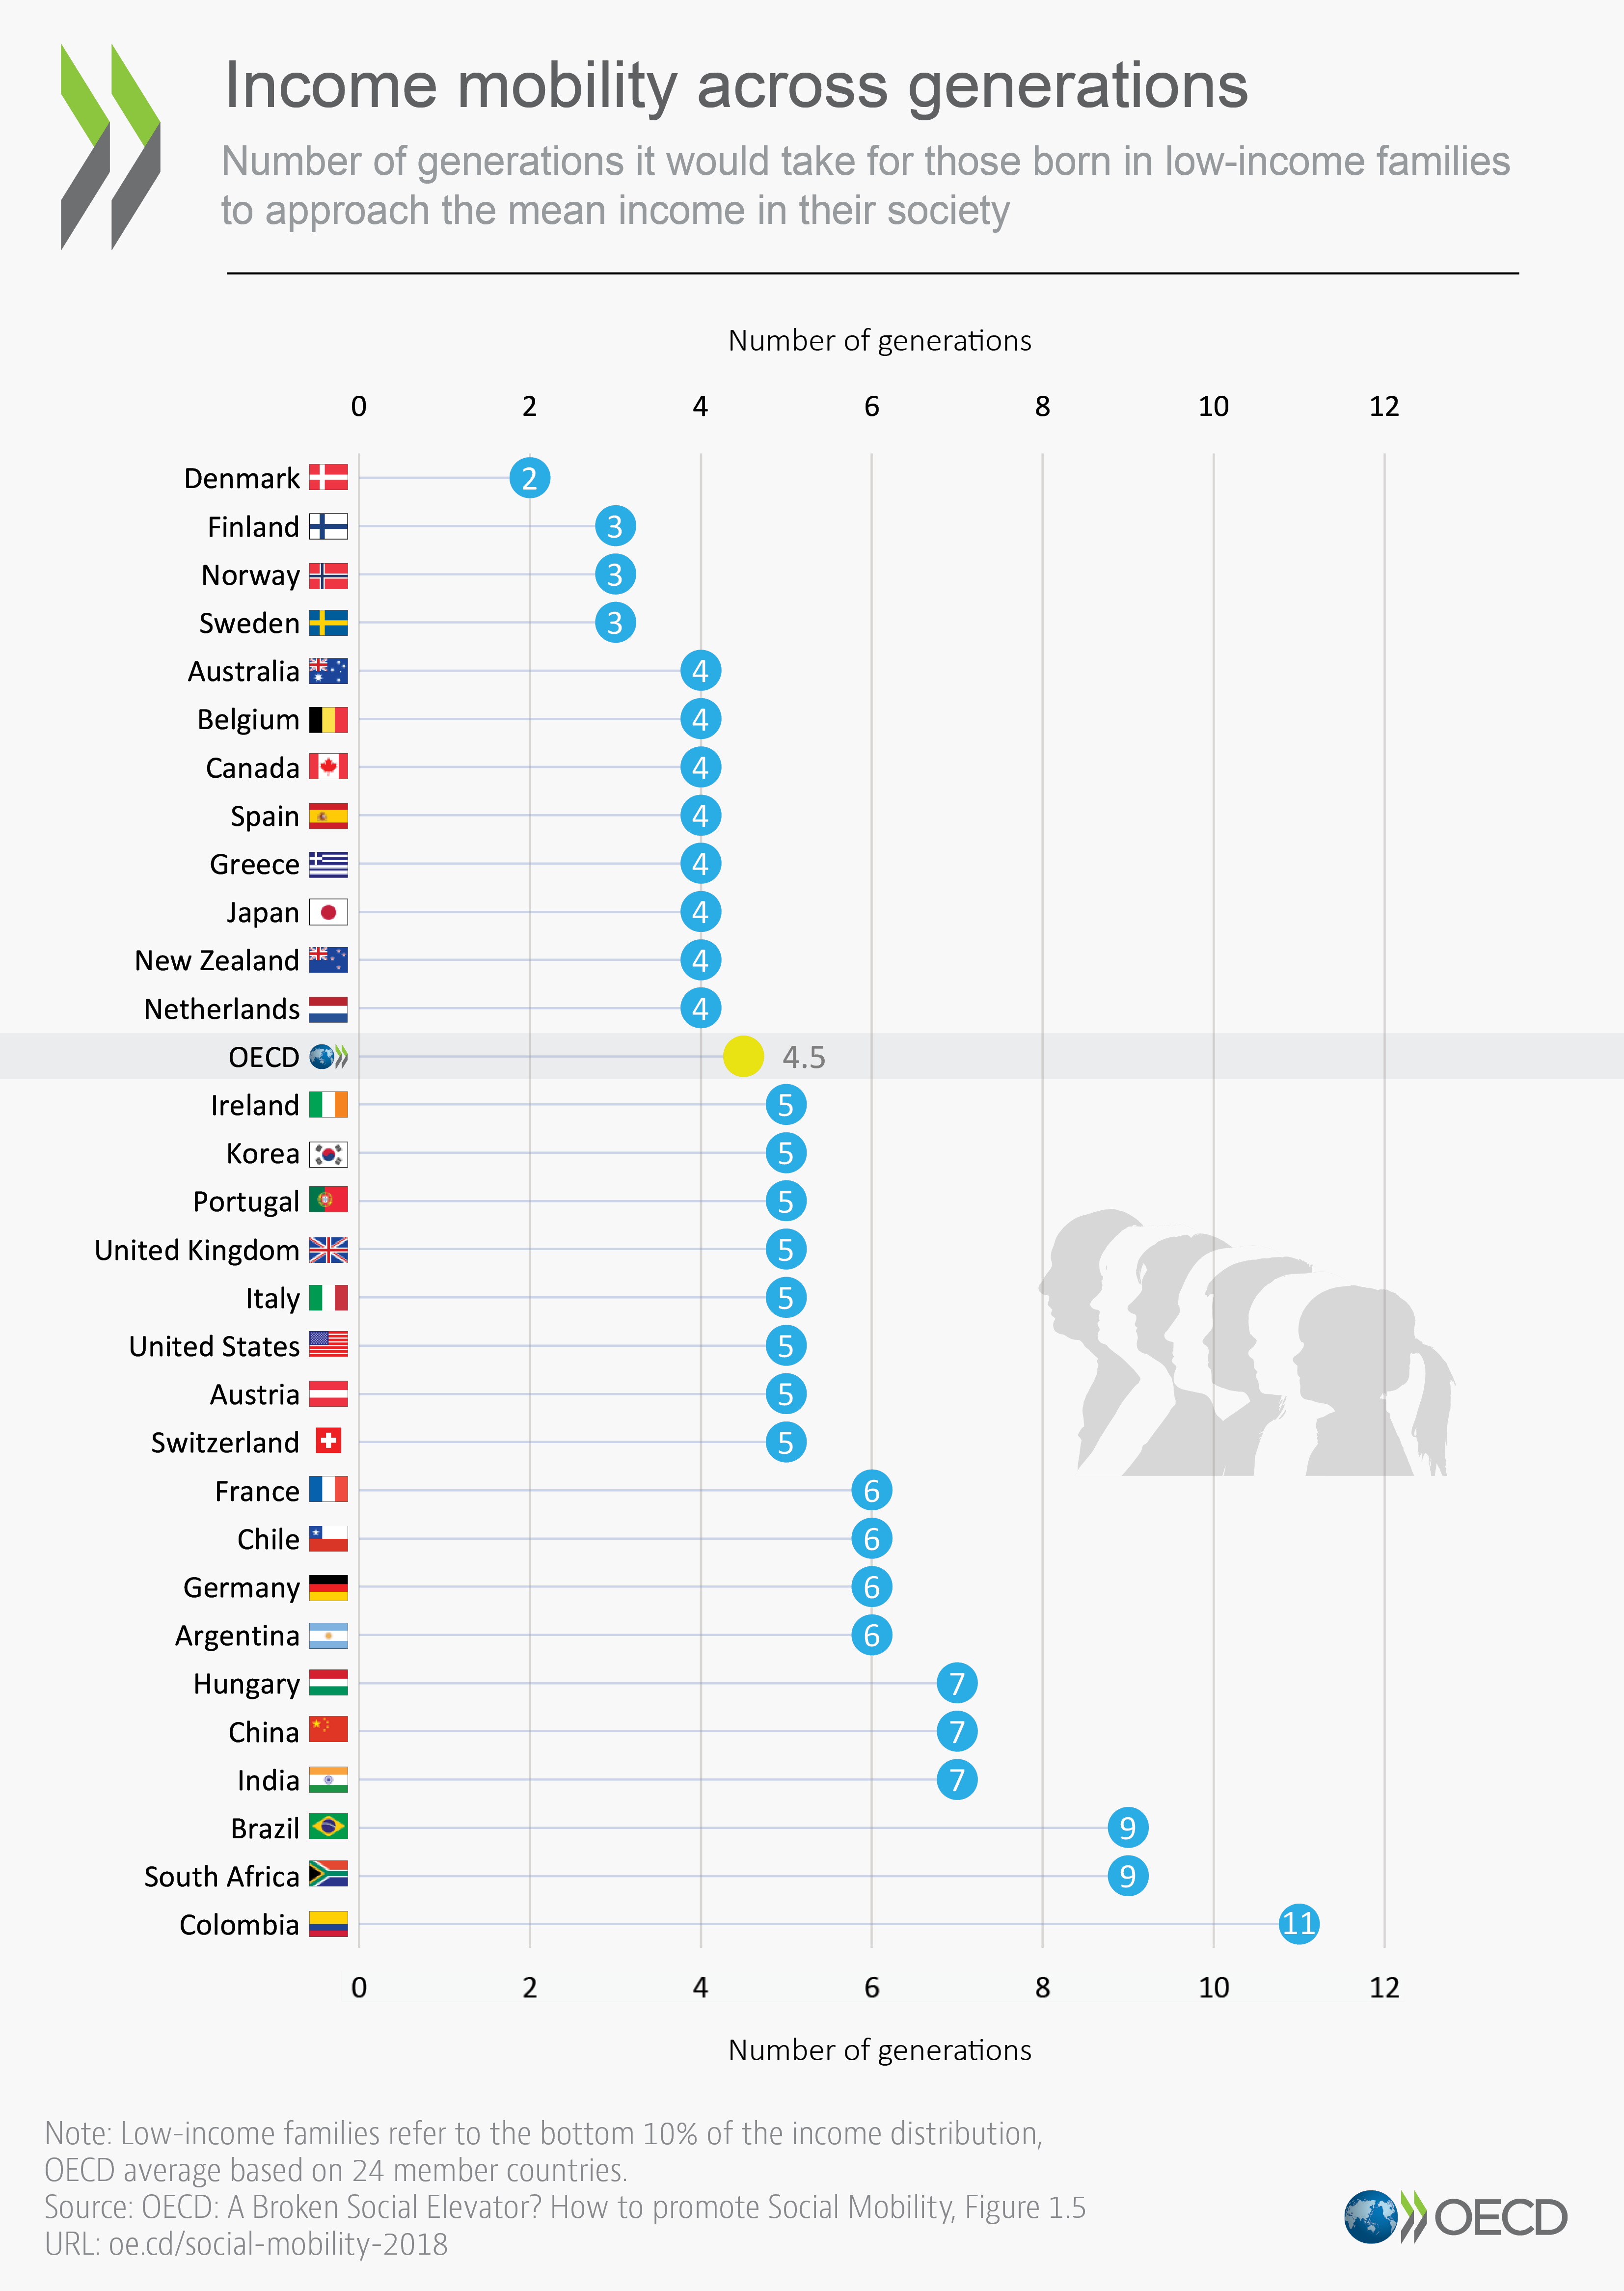
3. The chart talks about reaching mean income. Particularly in the US, mean income is higher than median income so even if achieving the latter is easier, achieving the former could be harder. To some extent the metric may disadvantage countries where the highest-earning few percent of the population earn a lot more than the median person.
That graph, and "social mobility" analysis in general, shows the movement from low income to average. This is good for a country overall, but it's irrelevant to the discussion that people are having in this thread. Most people here are more interested in the median to rich movement. Unfortunately this movement is practically impossible in countries like Sweden and NL (for an employee).
Let's take a typical profile that HN users would be interested in, a top10% engineer working for a big company. This person would never become rich in NL, but almost always become rich in the US.
>Most people here are more interested in the median to rich movement. Unfortunately this movement is practically impossible in countries like Sweden and NL (for an employee).
Same in Germany why I assumed the diagram would be appropriate. But you are 100% correct and I agree with
> This person would never become rich in NL, but almost always become rich in the US.
I moved from Europe to the US, and so have a lot of other people who aim to become rich. In europe most rich people inherit everything, mobility to upper class is basically non existent. Here it’s Very much possible
1. My intuition is wrong
2. There are lots of people in low income groups where there is little i regeneration along mobility for structural reasons, or maybe immigrants children who often see the biggest improvements are excluded for some reason.
3. The chart talks about reaching mean income. Particularly in the US, mean income is higher than median income so even if achieving the latter is easier, achieving the former could be harder. To some extent the metric may disadvantage countries where the highest-earning few percent of the population earn a lot more than the median person.