|
|
|
|
|
|
by nickthemagicman
1740 days ago
|
|
|
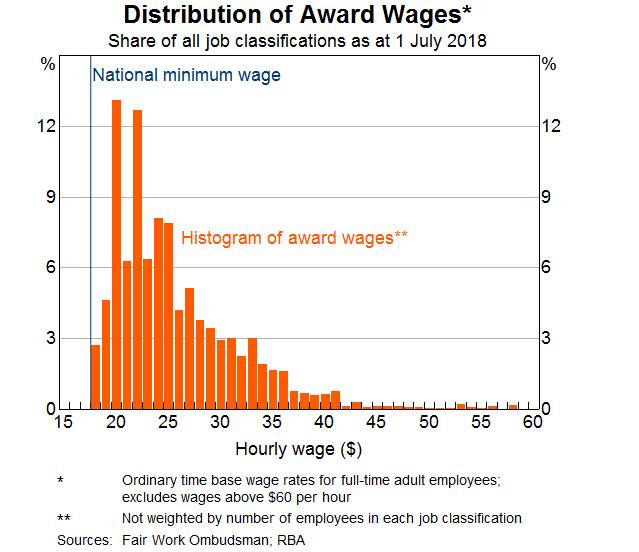
I think they're using the median instead of the mean for exactly this reason. It's a more robust measure central tendency. Looking at those rental prices it looked very accurate to me. The real problem is why would they compare minimum wage with median rental prices? Both are distributions. |
|
|
I don't know exact figures, but I'm absolutely certain that if you plotted the distribution of wages, you'd see a hugely disproportionate number at or just above the minimum wage. Y'know, because there's an artificial pressure (the law) preventing anyone from paying less.
Housing prices, meanwhile, are not subject to the same kinds of constraints. They likely follow a much more normal distribution (though not, I suspect, a normal distribution in the statistical sense).