Hacker News new | ask | show | jobs
by cryptica 1990 days ago
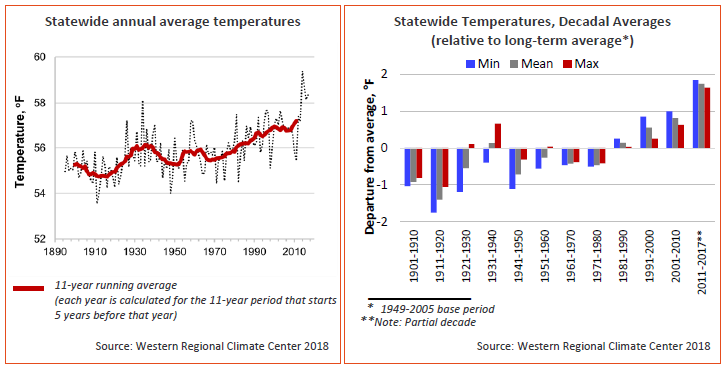
Over the last 20 years and having traveled back and forth all over the world, I have not noticed any changes in temperature at all. In fact, local temperature records over several decades seems to be flat in pretty much every place I've looked up. On the other hand, I have observed widespread deception within professional environments and scientific communities... I was a climate believer for a long time, but these days it seems more like a religion than a science so I'm now a skeptic. The authorities keep preaching the climate change mantra with increasing urgency and certainty but it doesn't stand up to scrutiny. I'm more concerned about microplastics and air pollution.
4 comments

> In fact, local temperature records over several decades seems to be flat in pretty much every place I've looked up.

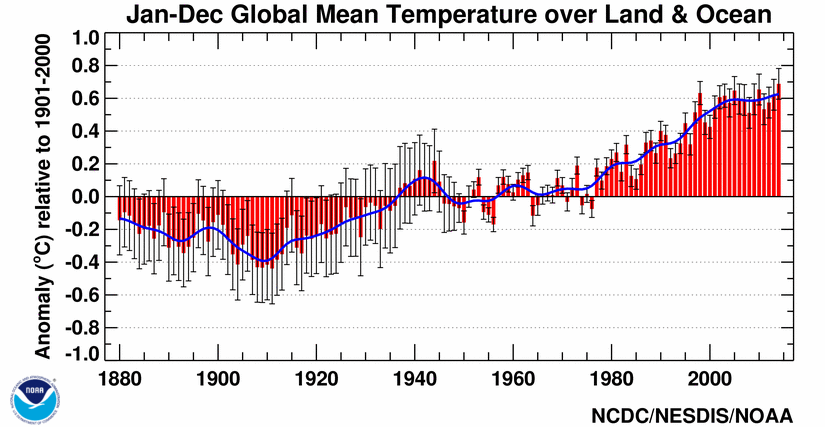
The first place I looked up was England - the Met Office graph seems to indicate a rise. [1]

Have you got any examples of flat graphs?

[1] https://www.metoffice.gov.uk/hadobs/hadcet/

Examples (I just picked two random places and dates for temperature records for the month of December at least 20 years apart):

Miami Florida December 2000 (peak day-average is 77.08): https://www.wunderground.com/history/monthly/us/fl/miami/KMI...

Miami Florida December 2020 (peak day-average is 76.69): https://www.wunderground.com/history/monthly/us/fl/miami/KMI...

---

Honolulu, Hawaii December 1995 (peak day-average is 79.92): https://www.wunderground.com/history/monthly/us/hi/honolulu/...

Honolulu, Hawaii December 2020 (peak day-average is 79.54): https://www.wunderground.com/history/monthly/us/hi/honolulu/...

---

You can use that site to look up the same month 20+ years apart in any place and it clearly shows that there is no significant change at all. You can browse the surrounding years to get a better feeling because there can be random 2 to 3 degree fluctuations but my point is that these fluctuations can go either way and there is no correlation with time.

TBH, I'm surprised that, given that there is an incentive for meteorologists to fake the data (since global warming is their bread and butter) that it's still possible to see proper data which certainly matches my personal observations. IMO it's a matter of time before they start faking historical data. Good we have waybackmachine https://archive.org/web/

You have scientifically accurate weather records from at least the 1920's onwards. Of all the temperature measurements on record you have decided to choose two single datapoints from two semi-tropical locations with low yearly thermal amplitudes.

I genuinely cannot tell if this is ill-intent or an internal struggle to revisit your previously held opinions when faced with the body of evidence of all the data collected after the industrial revolution.

Looking at a small number of weather stations is "evidence by anecdote" and completely unsound.

You introduce bias by your selection of measurements. Plus a large portion of the earth is scantly inhabited with no weather stations in place. Like the poles or international waters.

Instead you should look at satellite measurements of the temperature across the entire planet. These are widely available. The scientific discourse and the available evidence is much more advanced than "hey it became colder in those 20 places".

https://en.wikipedia.org/wiki/Satellite_temperature_measurem...

That's why I said to look at any place. It you want to make the argument that the temperature differences are so small that we shouldn't expect to notice any difference from looking at many different before and after charts then perhaps those differences should be considered statistically insignificant... More likely to be something wrong with the measuring instruments (maybe changes in the manufacturing process of these instruments), or people are becoming more deceptive when entering their measurements or being more selective in how they combine different measurements.

Why should I trust a heavily processed, combined result like the Wikipedia page you posted more than random sampling of raw data directly from local meteorologists? It's pretty obvious that the more 'processing' of the data is carried out, the more inaccurate it's going to be. By the time we get to the global mashup of the data, it's been so heavily tempered by people along the hierarchy that it's basically useless. The global statistics are not to be trusted, they're the result of many meteorologists and statisticians playing 'Chinese whispers' at a global scale.

Your data seems obviously cherry-picked. Why 2000/2020 in one case and 1995/2020 in the other? In fact, your last link actually goes to 2000, not 2020, which makes it look an awful lot like you looked at that year and didn't quote it because it doesn't fit your narrative.

For the Miami case, it is probably worth noting that Miami is cooler during El Nino events and warmer during La Nina. Of course, 2000 was in the middle of the latter and 2020 the former. In fact, if you look at more than 2 datapoints the trend over the past twenty years is the opposite of what you're saying.

So you've picked a couple of locations and dates at random, and gee, there is more noise than signal in your tiny sample.

Now try doing that systematically. Take the monthly averages over 20 years from a few thousand sites. Don't forget to correct for the urban heat-island effect, which creates a false impression of warming when a city grows out around an airport.

Do that, present your results, and it might be worth taking you seriously.

I don't know if average temperatures in December in Miami are particularly representative of anything, but I went to the trouble of plotting a graph of average December temperatures from the Miami link you gave, from 1990 to 2020, and I would say there does appear to be a slight upwards trend over time: https://img.incoherency.co.uk/3145

Picking 2 dates at random is not a good way to expose long-term trends, as evidenced by your observation that there can be several degrees of variation from one year to the next.

That's weird, because all the places I've traveled (in both US and EU) have had a clear rise in average temperature in the last 3 decades.

The country I live in has had the average temperature steadily rise by a full degree over the last 30 years. Which is visible in changes in flora and fauna and extreme weather.

Really makes me wonder where you get your data.

There were some unusual 'hottest on record' last year in the summer in some parts of Europe. But also there were a lot of 'coldest on record' in other places like the US and in Russia during the winter so it doesn't really mean much... This is bound to happen somewhere every year but you need to look at averages and try different years.
I mentioned average temperature twice in my comment, did you miss that? I looked at average temperatures for these locations over the last 100-ish years. Consistently all of these places rising averages. Below are some links to back that up.

If you disagree with this, please also provide some graphs that back up your observations.

California: https://oehha.ca.gov/sites/default/files/media/airtempfig12....

Spain: https://sailingtheatlantic.com/pdfs/climate_change_spain.pdf

Netherlands: https://www.clo.nl/sites/default/files/styles/clo_infographi...

Russia: https://cms.qz.com/wp-content/uploads/2014/08/russia-tempera...

Global: https://www.ncdc.noaa.gov/sotc/service/global/global-land-oc...

Well, okay then, i will take your precise data as a fact. All these scientists with their fake-data must surely be liars.
That's why it's called climate change and not global warming. More extremes.
That’s a bit like saying the section of a skate ramp you’re standing on is flat, so it must be flat at all points.
You're mistaken, we've recordings and the temperatures increased, albeit not as much as predicted by models.