The data in that "model" appears to stop before the end of 2014. The last year of Bitcoin price breaks that "model". I'm also using scare quotes because those kind of "models" should be scary because they're misleading at best.
I have ZERO evidence to believe that the trend will continue. This chart is pretty popular amongst cryptocurrency followers. I'd actually love to know what experienced trading analysts think about these type of predictions and whether similar non-crypto models exist.
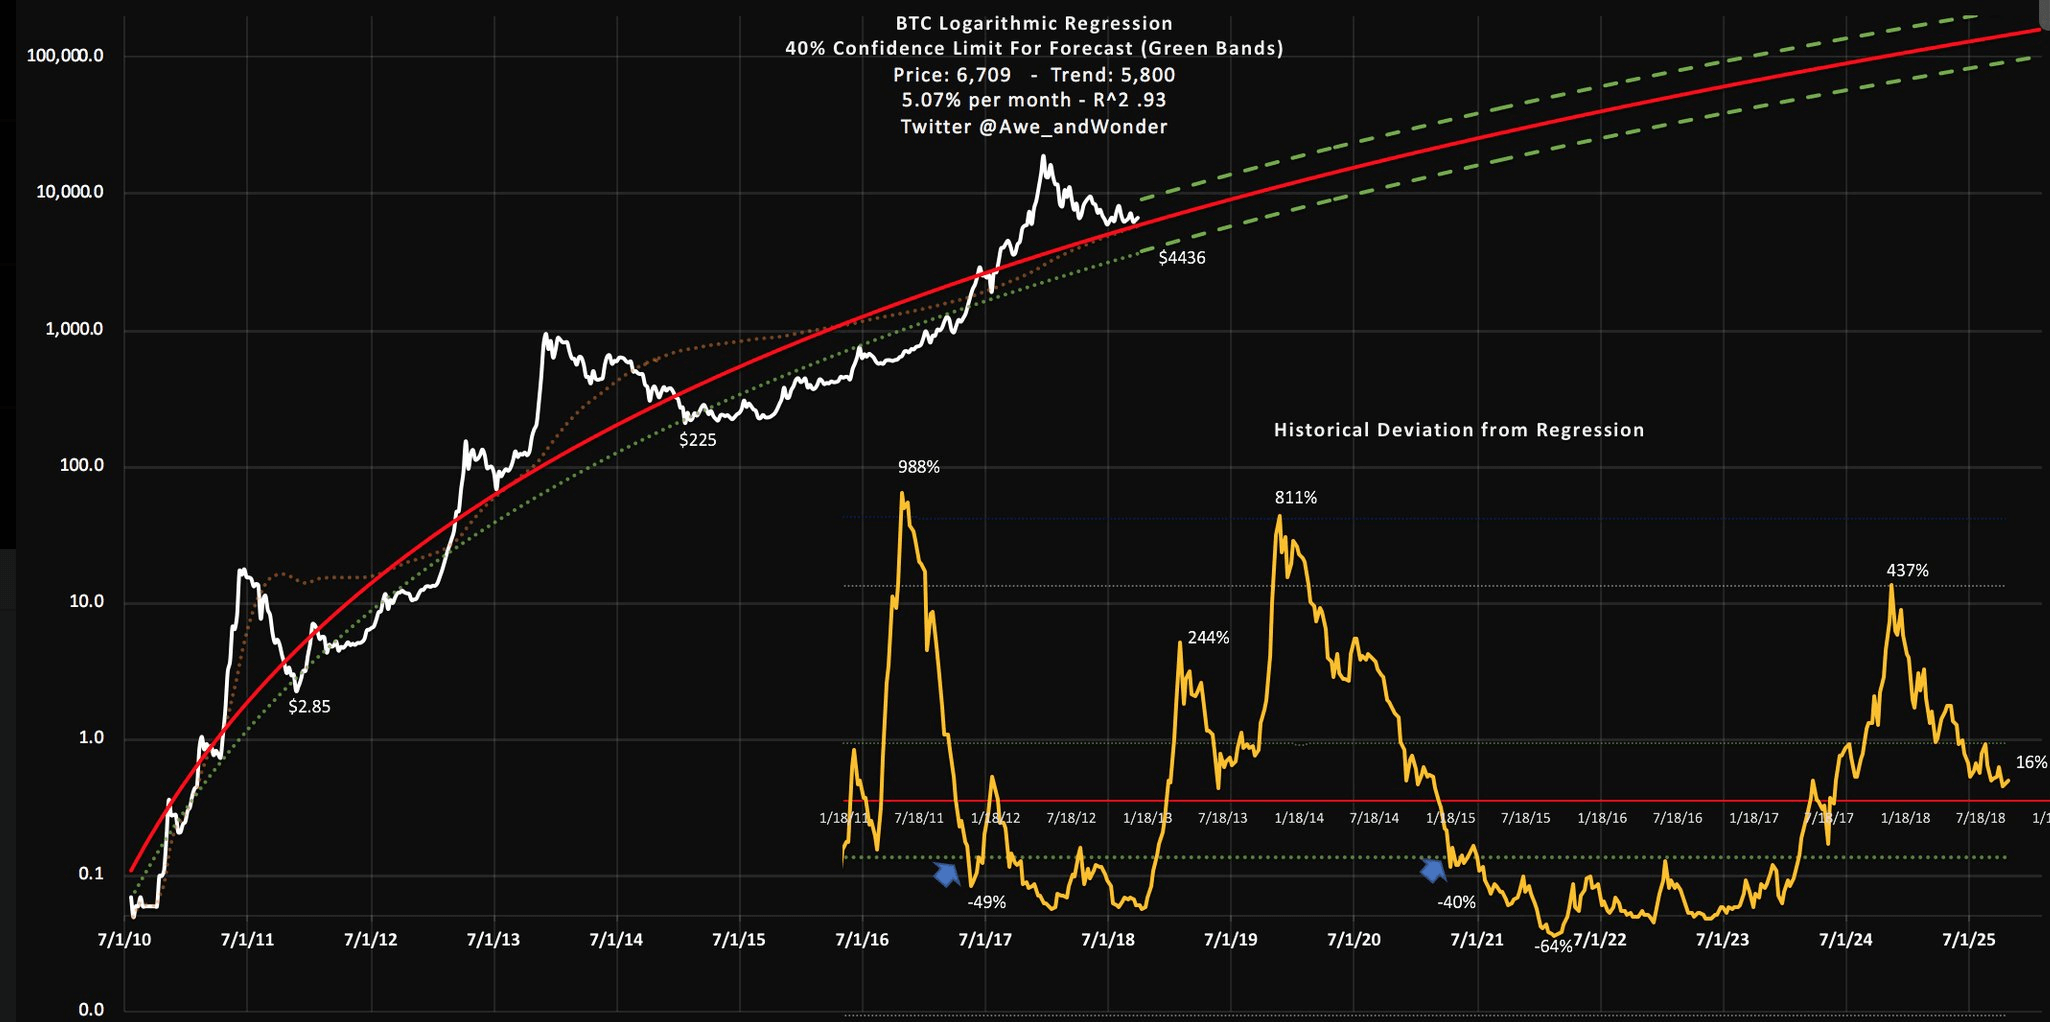
Interesting that it called $10K/Bitcoin only a month early, though, and did so 3 years in advance. The actual Bitcoin price underperformed the model by about an order of magnitude throughout 2015 as well as a long stretch in 2012; Bitcoin seems to have a "big bubble, then it bursts and plateaus for years" pattern.
Your first chart stated that BTC would be over $10,000 by the beginning of 2018, and be somewhere in the ballpark of $20,000+ by now. Your second chart drastically reduces that forecast. You do know you are just overfitting a curve to data here, right?
Well to be fair it is just refitting not overfitting. If it was overfitting it would have heaps of free parameters and match the data really closely. The criticism should be what is the mechanistic explanation for why you would expect this logarithmic trend (for the log price, is that just linear or am I just confused?)
The red curve is an average price. The first chart states that BTC would be $10,000 on 22-11-2017. On that day, the price was $8310. The prediction was made in 2014, so this is pretty accurate I must say. There is also a belief that the reason for inaccuracy of the first chart is because of a hardfork (Bitcoin Cash), that "ate" part of the Bitcoin's market. Afaik, the second chart was made by the same author a few days ago. It's obviously different, because it takes recent prices into consideration.