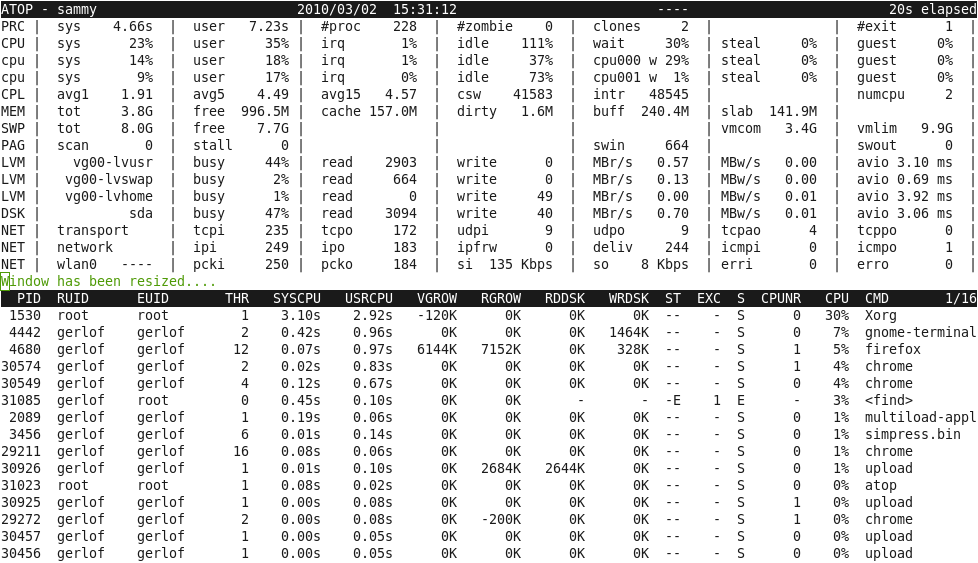
| atop is best top. One of the few bits of software I evangelise. Writes to replayable binary logfile with 10 minute system-state snapshots and uses process accounting to ensure it see's every process during that time. Gives more metrics than any other top; including network, disk and all the counters that you have to check the man page to know what they refer to. Its counterpart atopsar lets you replay the data for specific stats in an easily viewable format; i.e; - atopsar -m - this shows the memory stats for todays logfile in 10 minute increments. It goes on every single server I manage without exception. With atop you can actually see why it died instead of guessing from old log entries. Screenshot of atop : https://www.atoptool.nl/images/screenshots/genericw.png Example output of atopsar: # atopsar -m
*snipped* 2.6.32-896.16.1.lve1.4.51.el6.x86_64 #1 SMP Wed Jan 17 13:19:23 EST 2018 x86_64 2018/03/27
-------------------------- analysis date: 2018/03/27 --------------------------
00:00:02 memtotal memfree buffers cached dirty slabmem swptotal swpfree _mem_
00:10:02 14027M 928M 839M 6335M 1M 4645M 0M 0M
00:20:02 14027M 963M 842M 6393M 1M 4641M 0M 0M
00:30:02 14027M 756M 873M 6617M 1M 4638M 0M 0M
00:40:02 14027M 576M 871M 6596M 3M 4634M 0M 0M
https://www.atoptool.nl/index.php |