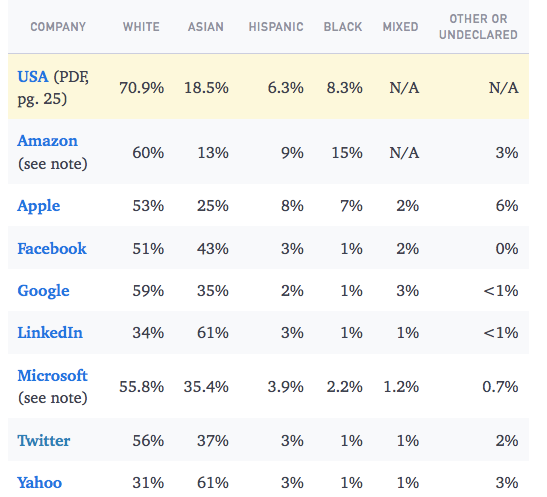
| HN moderators: It would probably be best if you buried my post. I idiotically misread the chart posted in the post. I originally thought the chart under ( https://cdn-images-1.medium.com/max/800/1*F9MLGQLTU2HZD4In6o... ) wasn't normalized to anything; but upon rereading i found that the top row is the comparison row and represents the percentages of working force age us citizens in the tech industry, which Twitter with its 1% falls far below. I'm sorry for my mistake. My original post below for context for the replies made to it, but which is otherwise useless. ------------------------------ It's alway a little confusing when people bring up diversity reports that aren't normalized to an appropiate comparison metric. (Possibly local demographics, or any number of more in-depth metrics. I also earlier suggested applicant demographics, but justizin pointed out those are not feasible.) Also see: https://xkcd.com/1138/ To bring it into contrast with the article, he says: "<5% make up engineering and product management combined." According to this census report: http://www.bayareacensus.ca.gov/counties/SanFranciscoCounty.... Race - Black or African American 48,870 6.1% The twitter numbers are thus a little below average, but not necessarily unexpected given where Twitter's headquarter is located. Edit: According to this, Twitter has roughly 30% asians: https://blog.twitter.com/2014/building-a-twitter-we-can-be-p... Which seems to fit the census as well: Race - Asian 267,915 33.3% Another Edit: To clarify, i am not saying that there is no problem. I'm merely saying that in order to solve a problem, one must both set appropiate goals, as well as correctly identify the root cause. Both of these can only be done usefully by applying statics correctly. |
That analysis assumes that the hiring base is predominately drawn from local people. Speaking anecdotally, I know many people who graduated from college and headed to the Bay Area to look for a job. I myself moved to Mountain View for a job, then later moved away.
A more complete analysis along the lines you took would look at where people in engineering and product management were, say, 1 or 5 years previous. That are would likely better characterize the relevant population statistics.
As an obviously contrived example, suppose people in engineering and product management are only in the Bay Area for 4 years, burn out, and leave, and suppose the companies offer free relocation from anywhere in the US. Then it doesn't make sense to look at the local demographics.
As a more real-world case, consider a place like Los Alamos National Labs, which has a large number of people from around the world working there, with a relatively high turnover rate partially due to interns, post-docs, and visiting professors. Los Alamos county was carved out for the lab, so the demographics of the county reflect the lab, but most of the people working at the lab are not from Los Alamos.
I do not have access to these sorts of numbers, merely pointing out how it's not easy to interpret the numbers you gave, or the certainty of your conclusion that it's a "not unexpected" result. I suspect the uncertainty is actually very high, and a shot-in-the-dark/back-of-the-envelope estimate isn't likely to be useful.